
Science with Passion

Application No.: VTN0049 Version 1 05/2026
Size matters – How to perform narrow calibration using the ClarityChrom® GPC Extension
J. Wesolowski, J. Kramer ,M. Grothe, J. Menke; wesolowski@knauer.net
KNAUER Wissenschaftliche Geräte GmbH, Hegauer Weg 38, 14163 Berlin

Summary
This technical note provides a practical, step-by-step workflow for creating a narrow calibration in the ClarityChrom® GPC extension. It guides users through the calibration process and demonstrates how to determine molecular weight distributions of samples using the generated calibration. In addition, it connects to related application and technical notes, offering extended insights and best practices for efficient GPC/SEC analysis.
Introduction
Gel Permeation Chromatography (GPC), also known as Size Exclusion Chromatography (SEC), is a separation technique that separates molecules based on their hydrodynamic size rather than chemical interactions. In a GPC column, separation is based on the ability of molecules to access the pores of the stationary phase. Smaller molecules can penetrate these pores and therefore spend more time inside the column, resulting in a delayed elution. Larger molecules, on the other hand, cannot enter the pores and pass through the column more quickly, leading to earlier elution. As a result, molecules are separated by size in solution, providing the basis for the determination of molecular weight and molecular weight distributions. Calibration is therefore a fundamental requirement for ensuring the accuracy and reliability of the results. The ClarityChrom® GPC Extension enables users to efficiently create and apply different calibration models for precise analysis. The workflow presented here focuses on narrow calibration using standards with defined molecular weights and low polydispersity (PD ≈ 1).
Sample Preparation
For a comprehensive guide on optimizing molecular weight determination using GPC/SEC, including sample preparation please refer to our application note:
VTN0042.
Workflow for Narrow Calibration
As previously mentioned, calibration is a fundamental aspect of GPC/SEC. The most common approach is narrow (also known as conventional or relative) calibration, which uses polymer standards with well-defined molecular weights and low polydispersity. This method establishes a relationship between elution volume and molecular weight specific to the chosen standards. Consequently, the obtained molecular weight values are relative when the sample differs chemically or structurally from the standards used to create the calibration curve. If, however, the sample and the calibration standards are chemically and structurally identical, true molecular weight values can be obtained. While relative calibration is sufficient for many applications, it does not generally provide true or absolute molecular weight or structural information about the sample. Other calibration options include broad standard calibration, and universal calibration. The choice of method depends thereby on factors such as the analytical goal, sample properties, detector configuration, and the availability and quality of standards. To perform a GPC calibration in the ClarityChrom® software, a calibration file must first be created, as shown in Fig. 1, steps 1-3. Within the calibration settings, one of four available calibration types must be selected, in this case, a narrow calibration was chosen (Fig. 1, step 4). Next, a calibration description must be entered (Fig. 1, step 5). Finally, the calibration file must be saved in the ClarityChrom® “Calib” folder (Fig. 1, steps 7-10).

Fig. 1 step 1-4: Workflow for creating a GPC calibration file.

Fig. 1 step 5-10: Workflow for creating a GPC calibration file.
After the GPC calibration file has been created and saved, it can be opened as shown in Fig. 2, steps 1-4. The calibration options can also be accessed for the created calibration file (Fig. 2, steps 5-6), which were initially selected during calibration file creation (Fig. 1). While the calibration type cannot be modified at a later stage, all other settings within the GPC calibration options remain adjustable, such as flow rate correction (VTN0043) or the use of universal calibration using the Mark-Houwink coefficients (VEV0084). Therefore, care should be taken during calibration file creation to select the correct calibration type.

Fig. 2 step 1-6: Overview of the opened GPC calibration file.
To load/import standard measurements into the calibration and construct a calibration curve, each standard chromatogram must first be properly integrated. For this, the measurements need to be opened in the chromatogram window (Fig. 3, steps 1-7), integrated using the integration tools of the software (Fig. 3, step 8), and subsequently saved (Fig. 3, step 9).

Fig. 3 step 1-4: Workflow for integrating standard chromatograms prior to calibration curve construction.

Fig. 3 step 5-9: Workflow for integrating standard chromatograms prior to calibration curve construction.
Next, the calibration curve can be constructed. Therefore, the previously created calibration file must be opened in the GPC calibration window, see Fig. 4, steps 1-5. Once the calibration file is opened, each standard can be accessed individually within the calibration file (Fig. 4, steps 6-9). The peaks can then be added either one by one or all at once (Fig. 4, step 10). Proper integration is therefore essential, as done in Fig. 3. Once all peaks have been added, the known molar masses of the individual peaks are assigned (Fig. 4, step 11). After all masses have been entered, the calibration curve is automatically generated by the software. The calibration equation and the correlation factor are then displayed.

Fig. 4 step 1-9: Workflow for constructing the GPC calibration curve.

Fig. 4 step 10-12: Workflow for constructing the GPC calibration curve.
These steps are repeated for each standard. This means a new standard is opened, the peaks are added, the molar masses are entered, and the calibration is saved as described in Fig. 4. The calibration curve is then automatically extended by the software (Fig. 5). The curve fit type can, as mentioned earlier, be adjusted in the calibration options and, for example, changed from cubic to a 5th-order polynomial (Fig. 6). In this context, the correlation factor should be as close as possible to 1, indicating the smallest possible deviation between the fitted curve and the calibration data.
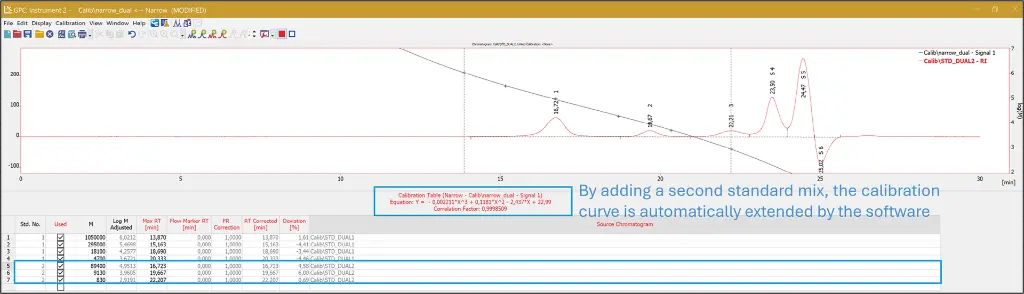
Fig. 5 Extension of the GPC calibration curve after inclusion of an additional standard.

Fig. 6 Adjustment of the curve fit type within the GPC calibration settings.
To apply the established calibration, a sample measurement must be opened in the chromatogram window (Fig. 7, steps 1–5), and the corresponding calibration file must be selected as shown in Fig. 7, steps 6–8. Subsequently, parameters such as the molecular weight at peak maximum (Mp) in the GPC results table are calculated based on the selected calibration. Finally, the results can be saved (Fig. 7, step 9).

Fig. 7 step 1-6: Workflow for applying a GPC calibration to a sample measurement.

Fig. 7 step 7-9 Workflow for applying a GPC calibration to a sample measurement.
Alternatively, the calibration can be assigned directly within the method (Fig. 8), allowing it to be applied automatically during data acquisition and evaluation.

Fig. 8 step 1-2: Calibration assignment within the method.
Additional Resources
Interested in GPC/SEC analysis?
Discover suitable systems and solutions here:
VIEW THE BROCHURE
Want to explore the software?
Download the ClarityChrom® GPC Extension demo version here:
DEMO DOWNLOAD
Want to improve your GPC/SEC workflow?
Learn how to boost data reproducibility and accuracy using a flow marker:
VTN0043
Struggling with system peaks?
Understand and manage system peaks for reliable analysis:
VTN0046
Looking for practical polymer analysis examples?
See how Poly [(R)-3-hydroxybutyric acid] (PHB) in chloroform is analyzed using GPC and universal calibration:
VEV0084
See how polystyrene (PS) and polymethylmethacrylate (PMMA) calibrations are compared across different solvents using GPC and universal calibration:
VTN0021
Conclusion
This technical note demonstrates how to successfully create and apply a narrow calibration using the ClarityChrom® GPC Extension. By following the outlined workflow, users can ensure reliable calibration and determination of molecular weight and molecular weight distributions. The described approach supports consistent and reproducible results, making it a valuable tool for routine GPC/SEC analysis. For further optimization and advanced applications, additional related technical and application notes can be consulted.
Material and Methods
Tab. 1 GPC system configuration.

Fig. 9 GPC system setup.
Application details