![]()
Science with Passion

Application No.: VTN0042 Version 1 05/2025
Optimizing molecular weight determination: A comprehensive guide to SEC/GPC
J. Wesolowski, J. Kramer, K. Folmert, G. Greco;
wesolowski@knauer.net
KNAUER Wissenschaftliche Geräte GmbH, Hegauer Weg 38, 14163 Berlin

3D-Rendering: KNAUER
Summary
This application note provides a comprehensive guide to the key steps involved in separation and molecular weight determination using Size Exclusion Chromatography (SEC)/ Gel Permeation Chromatography (GPC). It highlights the critical aspects of sample preparation, calibration and data analysis. To demonstrate these procedures, a KNAUER AZURA® GPC/SEC system with a refractive index detector (RID) was used to calibrate pullulan in water and polystyrene (PS) in tetrahydrofuran (THF) on different GPC/SEC columns. The calibrations were validated using various sugars and PS standards, with excellent results confirming the reliability and versatility of both calibrations. In addition, common challenges encountered in SEC/GPC applications are discussed, together with practical strategies for overcoming these problems.
Introduction
Gel Permeation Chromatography (GPC), Size Exclusion Chromatography (SEC) and less colloquial Gel Filtration Chromatography (GFC) are names used to describe the same liquid chromatographic technique required to determine important properties of macromolecules, like polymers, biopolymers, polysaccharides, or proteins. For example, the molecular weight distribution and some structural properties of polymers and proteins can be determined in a single injection using standard equipment for liquid chromatography, providing critical insight into their functionality and performance. The separation process (Fig. 1) behind each of these terms, is the same, it is based on hydrodynamic volume, not molecular weight, but scientists from different backgrounds talk about the technology in different ways. The term GPC is mostly used by chemists and scientists working with synthetic polymers or plastics. Many of these materials are only soluble in organic solvents, so the term GPC is often associated with separations in organic solvents. The term SEC, and less commonly GFC, is mostly used by biologists or scientists who need to purify or separate biological molecules such as proteins or oligonucelotides. This usually requires an aqueous mobile phase, so the term SEC or GFC is frequently used for separations in aqueous solvents.
In contrast to High Performance Liquid Chromatography (HPLC), where the separation process is based on the chemical interactions between the analyte and the stationary phase, GPC does not involve processes such as adsorption, ionic interaction or distribution.
As illustrated in Fig. 1 the elution profile of different-sized polymers reveals key differences in their behavior within the column. Smaller molecules or polymers can diffuse into the pores of the stationary phase, leading to a longer retention time. Conversely, larger polymers are less likely to enter these pores and therefore pass through more quickly, resulting in a shorter retention time as shown in the right chromatogram of Fig. 1.
Fig. 1 GPC/SEC separation principle.
Calibration is a fundamental aspect of SEC/GPC that ensures the accuracy and reliability of molecular weight determination. This includes the creation of a standard calibration curve using defined molecular weight standards, which serve as a reference for the interpretation of sample data (Fig. 2). The chosen calibration standards should be as close as possible to the sample material to assure the best results.

Fig. 2 GPC/SEC calibration, where the blue peak refers to the analyte with the smallest and red to the one with the biggest molar mass in the separation range of these calibration.
It is important to ensure that the conditions such as solvent or temperature are identical during calibration and sample measurement as even small deviations can lead to significant variations in the characterisation of samples. In summary, this means that the separation is carried out by the molecular size/hydrodynamic volume of the sample molecules, but the result of the measurement is given as the relative molecular weight, which is calculated from the calibration curve.
Sample Preparation
When preparing samples for GPC/SEC the choice of solvent has a direct effect on the solubility and stability of the sample. In addition, stirring should be avoided during the dissolution process. Techniques such as vortexing or centrifugation are also not recommended as they can change the molecular weight distribution and conformation of the sample. Such changes can lead to incorrect results and affect the quality of the analysis. The sample concentration range can be between 0.1 to 10 mg/ml. However, it is important to note that higher concentrations can lead to increased viscosities, which may affect both peak shape and retention time. This, in turn, can impact molecular weight distribution and molecular weight determination. Therefore, it is recommended to reduce the sample concentration until the peak position and shape remain constant. Increasing the injection volume, not the concentration, can enhance the signal-to-noise ratio if not sufficient. In general, samples should be freshly prepared and analysed as quickly as possible to obtain the best results. However, it is important to note that it can sometimes take several days for a sample to completely dissolve. Patience is therefore an essential part of the process.
For calibration with pullulan a kit covering a range from 180 to 1 450 000 Da was used. The standards were dissolved in water and left standing for one hour to assure complete dissolution. For calibration with polystyrene (PS), a kit with a molar mass range of 266 to 66 000 Da was used. The calibration standards were filled with tetrahydrofuran (THF) and left to dissolve for one hour. To further extend the calibration range for polystyrene, an additional calibration kit was used. This kit consisted of spatulas divided into two different sets, A and B, covering a range from 580 to 6 545 000 Da. The spatulas were placed in a vial containing THF and allowed to dissolve for one hour.
Glucose, maltose, maltotriose and maltotetraose were dissolved in water overnight at room temperature without stirring to a concentration of 2 mg/ml and then filtered through a 0.45 μm nylon filter. Similarly, the polystyrene standards with molecular weights of 11 600 Da and 336 000 Da were dissolved in THF to the same concentration of 2 mg/ml and left overnight at room temperature without stirring before being filtered through a 0.45 μm nylon filter as well.
Results
Column test
As part of the preparation for GPC/SEC measurements, a column test was conducted in accordance with the specifications outlined in DIN EN ISO 13885-3 for GPC/SEC applications using water as the eluent1, and according to DIN EN ISO 13885-1 for GPC/SEC applications using THF as the eluent2. Both documents specify that, in order to achieve good reproducibility of test results, the minimum requirements for peak broadening, expressed in terms of the number of theoretical plates, must be reached. For this purpose, a specified test substance is tested under defined conditions and the peak is evaluated using formula (1):
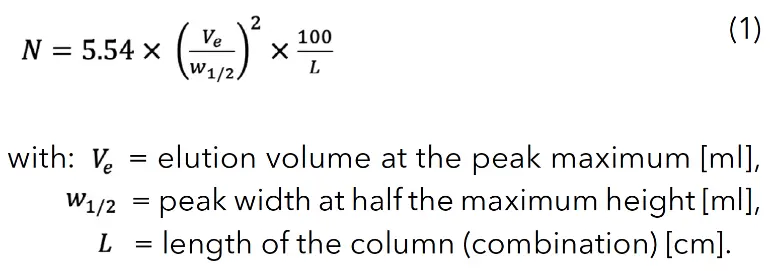
Accordingly, for water as eluent at least 10 000 theoretical plates per meter and in the case of THF as eluent 20 000 theoretical plates per meter should be achieved.
In this application, all columns were obtained from AppliChrom® and had dimensions of 300 x 8 mm. For the aqueous method a column combination was used. The two columns have the same hydrophilic polymeric base material but with different pore sizes. In contrast, for the organic method with THF, one column with Broad Pore distribution Technology (BPT) was applied with styrene-divinylbenzene as stationary phase. The results of the tested columns and column combination are given in Tab. 1. It can be seen that with each column and column combination the acceptance criteria was achieved.
Tab. 1 Results from the column test.

The coupling of columns in GPC/SEC is a common method to increase the resolution or extend the separation range. The choice of columns to be coupled is therefore crucial. If columns with identical pore sizes are combined, the resolution increases. In contrast, combining columns with different pore sizes expands the separation range. A direct comparison of the two coupling methods is summarized in Tab. 2. In this application, two columns with same base material but different pore sizes of 150 Å and 350 Å were coupled together with increasing pore size, in order to increase the separation range to 100 - 1 000 000 Da (Tab. 1).
Tab. 2 Criteria for coupling options for single pore size columns.
|
Criterium |
Columns of same |
Columns of different |
|
Separation range |
Small separation range
|
Wide separation range (separation area increased with each additional column)
|
|
Separation |
Increased separation performance (increased column bed length) |
Optimized separation (each column can be optimized for a specific size range) |
|
Resolution |
High resolution for similar molecular sizes
|
Improved resolution for different molecular sizes
|
|
Calibration |
Small calibration range |
Large calibration range |
|
Peak overlap |
Lower risk of overlaps for similar molecule sizes (in the separation range) |
Higher risk of overlaps for similar molecule sizes (in the separation range) |
|
Analysis time |
|
|
Before combining columns with different pore sizes, make sure that your columns do overlap in their separation ranges to avoid gaps in your resolution range. An example of an inefficient combination would be the use of a SuperOH-P-100 column (separation range: 100 - 2 500 Da) together with a SuperOH-P-400 column (separation range: 10 000 - 5 000 000 Da), which would result in not covering the range between 2 500 - 10 000 Da. At the same time, it should be noted that a significant loss of resolution can be caused in the overlapping separation range. This is because molecules may be retained differently in these areas due to different retention mechanisms of the columns, resulting in broader peaks in the chromatogram and incorrect molar masses. Consequently, the choice of columns when combining is critical. Regarding the order in which the columns should be combined, it can be said that the order has no impact on retention times or molecular weight distribution calculations [3, 4]. Columns can be coupled with either increasing or decreasing pore size, as long as the sequence remains consistent [3, 4].
Calibration
Two relative calibrations were created. The first one with pullulan in water and the second one with PS in THF. Fig. 3 shows a 11-point calibration with pullulan in water in the molar mass range 180 to 739 000 Da. The largest molar mass of 1 450 000 Da (dark blue cap) is outside the separation range of the column combination (Tab. 1) and was therefore not taken into account. The 11 calibration points were fitted with a 5th degree polynomial with deviations below 7 % (Tab. 3), which, together with a correlation factor close to 1 (Fig. 3), indicates an excellent fit and therefore high accuracy of the calibration.
; light blue = light blue cap (739 000 Da, 107 000 Da, 9 800 Da, 504 Da); yellow = yellow cap (348 000 Da, 49 400 Da, 6 400 Da, 180 Da). Fit function of the 5th degree. R2 = 0.999")
Fig. 3 11-point pullulan calibration in water measured with ABOA SuperOH-P-150 - ABOA SuperOH-P-350. Dark blue = dark blue cap (1 450 000 Da, 216 000 Da, 21 900 Da, 991 Da); light blue = light blue cap (739 000 Da, 107 000 Da, 9 800 Da, 504 Da); yellow = yellow cap (348 000 Da, 49 400 Da, 6 400 Da, 180 Da). Fit function of the 5th degree. R2 = 0.999.
Tab. 3 Summary of the results for the calibration with pullulan in water, calculated with ClarityChrom software.
Calibration equation
Y= -0.0004468×X5+0.03375×X4-1.009×X3+14.91×X2-109.2×X+323.7
|
Standard |
Mp |
Log M |
max. RT [min] |
Deviation [%] |
Mp, calculated from calibration[Da] |
|
Dark blue cap |
991 |
2.9961 |
17.35 |
1.49 |
976 |
|
21900 |
4.3404 |
14.48 |
6.65 |
20444 |
|
|
216000 |
5.3345 |
11.75 |
4.09 |
207166 |
|
|
Light blue cap |
504 |
2.7024 |
18.04 |
-0.40 |
506 |
|
9800 |
3.9912 |
15.17 |
0.93 |
9709 |
|
|
107000 |
5.0294 |
12.58 |
-4.51 |
111826 |
|
|
739000 |
5.8686 |
10.57 |
-0.35 |
741587 |
|
|
Yellow cap |
180 |
2.2553 |
18.98 |
-0.08 |
180 |
|
6400 |
3.8062 |
15.49 |
-5.36 |
6743 |
|
|
49400 |
4.6937 |
13.57 |
-1.24 |
50013 |
|
|
348000 |
5.5416 |
11.16 |
-0.64 |
350227 |
The calibration of PS in THF is shown in Fig. 4. As for the calibration in water, the calibration standards were fitted by a 5th degree polynomial with deviations below 3 % (Tab. 4), which together with a correlation factor close to 1 (Fig. 4), as for the pullulan calibration, indicates an excellent fit and therefore a high accuracy of the calibration. In the case of the PS calibration, two standards with the largest molar masses of 6 570 000 Da (spatula A) and 2 703 000 Da (spatula B) are outside the separation range of the column (Tab. 1) and were therefore not included. In addition, the separation of the standards in the lower molar mass range is more difficult due to the very wide separation range of the column, so that only the highest molar mass from each vial (black, blue and yellow cap) could be used (Tab. 4). Therefore, instead of a 22-point calibration, an 11-point calibration was performed in the range 580 to 739 500 Da (Fig. 4). To optimise the separation range in the lower molecular weight range, it is possible to switch to a column that covers a smaller separation range. An example of this would be the StyDiViBe-P-100Å column, which covers a separation range of 100 to 10 000 Da. This change allows more accurate analysis and better resolution of low molecular weight compounds.
; purple: spatula B (2 327 000 Da, 298 600 Da, 75 050 Da, 9 310 Da, 580 Da); black = black cap (66 000 Da, 15 700 Da, 4 840 Da, 1 306 Da); blue = blue cap (42 400 Da, 8 680 Da, 3 470 Da, 474 Da); yellow = yellow cap (25 500 Da, 6 540 Da, 2 280 Da, 266 Da). Fit function of the 5th degree. R2 = 0.999.")
Fig. 4 11-point PS calibration in THF measured with StyDiViBe-P-10E5A-BPT. Green = spatula A (6 545 000 Da, 739 500 Da, 128 900 Da, 29 460 Da, 3 320 Da); purple: spatula B (2 327 000 Da, 298 600 Da, 75 050 Da, 9 310 Da, 580 Da); black = black cap (66 000 Da, 15 700 Da, 4 840 Da, 1 306 Da); blue = blue cap (42 400 Da, 8 680 Da, 3 470 Da, 474 Da); yellow = yellow cap (25 500 Da, 6 540 Da, 2 280 Da, 266 Da). Fit function of the 5th degree. R2 = 0.999.
Tab. 4 Summary of the results for the calibration with PS in THF, calculated with ClarityChrom software.
Calibration equation
Y= - 0.0005161×X5+0.02138×X4-0.363×X3+3.161×X2-14.49×X+34.16
|
Standard |
Mp |
Log M |
max. RT [min] |
Deviation [%] |
Mp, calculated from calibration[Da] |
|
Spatula B |
298600 |
5.4751 |
7.61 |
-0.63 |
300481 |
|
75050 |
4.8754 |
9.15 |
1.75 |
73737 |
|
|
9310 |
3.9689 |
10.98 |
0.79 |
9236 |
|
|
580 |
2.7634 |
12.23 |
0.19 |
579 |
|
|
Spatula A |
739500 |
5.8689 |
6.74 |
0.12 |
738613 |
|
128900 |
5.1103 |
8.55 |
1.50 |
126967 |
|
|
29460 |
4.4692 |
10.09 |
1.06 |
29148 |
|
|
3320 |
3.5211 |
11.54 |
-0.82 |
3347 |
|
|
Yellow cap |
25500 |
4.4065 |
10.21 |
-2.92 |
26245 |
|
Blue cap |
42400 |
4.6274 |
9.72 |
-0.93 |
42794 |
|
Black cap |
66000 |
4.8195 |
9.24 |
-0.02 |
66013 |
To confirm the calibration, various sugars of known molar mass were analysed using the established pullulan calibration, while two narrow PS standards were evaluated using the corresponding PS calibration. The values obtained from both calibration methods were then compared with the known molar mass to ensure the accuracy and reliability of the calibrations. Both chromatograms for the sugar and PS standards are shown in Fig. 5 and Fig. 6 with the corresponding calibration curve.

Fig. 5 Chromatogram of the sugars with the corresponding pullulan calibration. Green: maltotetraose; pink: maltotriose; purple: maltose; orange: glucose. Measured with ABOA SuperOH-P-150 - ABOA SuperOH-P-350.

Fig. 6 Chromatogram of the PS standards with the corresponding PS calibration. Blue: PS 11600; orange: PS 336000. Measured with StyDiViBe-P-10E5A-BPT.
Tab. 5 and Tab. 6 summarise the results of the measurements for the sugar and PS standards. Both tables show the real and calculated molar masses as well as the deviations in percent.
Tab. 5 Results of the evaluation of the sugars with the pullulan calibration in water.
|
Substance |
Mp, real [Da] |
Mp, calculated [Da] |
Deviation [%] |
|
Maltotetraose |
667 |
681 |
2.10 |
|
Maltotriose |
504 |
514 |
1.98 |
|
Maltose |
342 |
340 |
-0.58 |
|
Glucose |
180 |
185 |
2.78 |
Tab. 6 Results of the evaluation of the PS standards with the PS calibration in THF.
|
Substance |
Mp, real [Da] |
Mp, calculated [Da] |
Deviation [%] |
|
Polystyrene |
11600 |
11904 |
2.62 |
|
Polystyrene |
336000 |
346862 |
3.23 |
Discussion
Overall, the results of both tables show that the calculated molar masses are close to the real molar masses. The deviations are less than 4 % for the PS calibration and less than 3 % for the pullulan calibration. Therefore, the accuracy of the calibration can be confirmed in these ranges. However, if larger deviations occur at higher molecular weights, this could indicate that the calibration method needs to be optimised. To improve both calibrations it would be possible to add more points in the calibration by using more standards that are in the separation range of the column. Furthermore, it is possible to use a flow marker to correct errors due to retention time shifts.
It is also important to note that accurate determination of the molecular weight of a sample is only possible if its chemical structure matches the standards used to create the calibration curve. However, if the sample differs in its chemical or structural composition from these standards, the results may be inaccurate5. For example, a calibration standard such as pullulan and a protein sample may have similar hydrodynamic diameters and show comparable retention times in the chromatogram despite their different molar masses. This means that the molecular weight of the protein is incorrect or relative. The reason for this is that the calibration is based on pullulan standards, which do not have the same structure as the protein being analysed. This highlights the importance of choosing standards consciously to ensure that the results are valid. A promising approach to improve the analysis is the use of universal calibration. This could reduce the dependence on specific standards and extend the applicability of GPC/SEC to many sample types. To be able to create such a universal calibration, the specific Mark-Houwink constants of the used standard and the sample under the measured method conditions are required. The specific constants can be taken from literature sources or determined by using a viscometer measuring the intrinsic viscosity in addition to the RID.
Conclusion
Using the KNAUER AZURA® GPC/SEC system it is possible to create calibrations with strong organic as well as aqueous solvents. Furthermore, the system can be customised or upgraded to meet specific requirements. For example, an additional detector can be integrated.
To ensure good reproducibility of test results, it was essential to meet the minimum requirements for peak broadening, as indicated by the number of theoretical plates. Therefore, all used columns were successfully tested based on official DIN EN ISO regulations. For calibration with pullulan standards in water, a combination of two columns with different pore sizes was employed to increase the separation range, while for calibration with PS standards in THF, a column with a larger separation range was used. The calibrations were evaluated using samples of known molar mass, specifically sugar for the pullulan calibration and PS standards for the PS calibration. The deviations were found to be less than 4% for the PS calibration and less than 3% for the pullulan calibration. Consequently, the accuracy of the calibration can be confirmed within these ranges. In summary, users can significantly improve the reproducibility and reliability of their analytical results by following common guidelines and considering key factors.
Material and Methods
Tab. 7 Calibration standard kits.
|
Kit |
Manufacturer |
Content |
|
ReadyCal Pullulan high |
Agilent Technologies |
Kit contains three different vials with pre-weighed standards of different molar masses ranging from 180 to |
|
ReadyCal Polystyrene low |
Agilent Technologies |
Kit contains three different vials with pre-weighed standards of different molar masses ranging from 266 to |
|
EasiCal PS-1 |
Agilent Technologies |
Kit consisted of two different each containing ten detachable spatulas coated with a mixture of five molar masses ranging from 580 to |
Tab. 8 Method parameter.
|
Parameter |
Water Method |
THF Method |
|
Flow rate |
1 ml/min |
1 ml/min |
|
Isocratic |
H2O |
THF |
|
Column temperature |
25 °C |
25 °C |
|
Injection volume |
20 µl |
20 µl |
|
Injection mode |
Partial loop |
Partial Loop |
|
Detection |
RID |
RID |
|
Data rate |
10 Hz |
10 Hz |
|
Time constant |
0.1 s |
0.1 s |
|
Time |
30 min |
20 min |
Tab. 9 GPC system configuration.
|
Instrument |
Description |
Article No. |
|
Pump |
AZURA P 6.1L isocratic HPLC pump with 10 ml pump head for normal phase applications, stainless steel |
|
|
Degasser |
Analytical 2 channel GPC degasser |
|
|
Autosampler |
AZURA AS 6.1L |
|
|
Detector |
AZURA RID 2.1L |
|
|
Thermostat |
AZURA CT 2.1 |
|
|
Eluent tray |
AZURA E 2.1 L |
|
|
Column |
AppliChrom StyDiViBe-P-10E5A-BPT, 10 µm, 300 x 8 mm, 500 - 1 500 000 Da |
|
|
Capillaries |
Start-Up Kit with flexible, precut capillaries for analytical HPLC systems with 1/16" connections |
|
|
Software |
ClarityChrom 9.1.0 - Workstation, autosampler control included |
|
|
Software |
ClarityChrom 9.1.0 - SEC/GPC extension |
, autosampler; right from top to bottom: degasser, thermostat with column")
Fig. 7 GPC system setup; from top to bottom: eluent tray with bottles, pump, refractive index detector (RID), autosampler; right from top to bottom: degasser, thermostat with column.
Tab. 10 SEC system configuration.
|
Instrument |
Description |
Article No. |
|
Pump |
AZURA P 6.1L LPG Pump with 10 ml pump head, stainless steel |
|
|
Autosampler |
AZURA AS 6.1L |
|
|
Detector |
AZURA RID 2.1L |
|
|
Thermostat |
AZURA CT 2.1 |
|
|
Eluent tray |
AZURA E 2.1 L |
|
|
Column 1 |
AppliChrom SuperOH-P-150, 7 µm, 300 x 8 mm, 100 - 5 000 Da |
|
|
Column 2 |
AppliChrom SuperOH-P-350, 10 µm, 300 x 8 mm, 2 500 - 1 000 000 Da |
|
|
Column 3 |
AppliChrom StyDiViBe-P-10E5A-BPT, 10 µm, 300 x 8 mm, 500 - 1 500 000 Da |
|
|
Capillaries |
Start-Up Kit with flexible, precut capillaries for analytical HPLC systems with 1/16" connections |
|
|
Software |
ClarityChrom 9.1.0 - Workstation, autosampler control included |
|
|
Software |
ClarityChrom 9.1.0 - SEC/GPC extension |
, autosampler; right: thermostat with columns")
Fig. 8 SEC system setup; from top to bottom: eluent tray with bottles, pump, refractive index detector (RID), autosampler; right: thermostat with columns.
References
[1] DIN EN ISO 13885-3:2021-11, Gelpermeationschromatographie_(GPC)_- Teil_3: Wasser als Elutionsmittel (ISO_13885-3:2020); Deutsche Fassung EN_ISO_13885-3:2021. (2021).
[2] DIN EN ISO 13885-1:2021-11, Gelpermeationschromatographie_(GPC)_- Teil_1: Tetrahydrofuran_(THF) als Elutionsmittel (ISO_13885-1:2020); Deutsche Fassung EN_ISO_13885-1:2021. (2021).
[3] Radke, W. (2022). Tips & Tricks: Column Order in GPC/SEC. LCGC International. https://www.chromatographyonline.com/view/tips-tricks-column-order-in-gpc-sec (Last access: 26.02.2025)
[4] Kempf, B. (2010). Which GPC Column First?. LCGC International. https://www.chromatographyonline.com/view/which-gpc-column-first (Last access: 26.02.2025)
[5] Heinzmann, G., Heinzmann A., Heinzmann S. (2023). Die Universelle Kalibrierung in der Gelpermationschromatographie. Analytik NEWS. Das Labormagazin. https://analytik.news/fachartikel/2023/44.html (Last access: 26.02.2025)
Application details
|
Method |
GPC/SEC |
|
Mode |
GPC/SEC |
|
Substances |
Ethylene glycol, Ethylbenzene, Pullulan, Polystyrene, Maltose, Glucose, Maltotriose, Maltotetraose |
|
CAS number |
107-21-1, 100-41-4, 9057-02-7, 9003-53-6, 6363-53-7, 50-99-7, 1109-28-0, 34612-38-9 |
|
Version |
Application No.: VTN0042 | Version 1 5/2025 | ©KNAUER Wissenschaftliche Geräte GmbH |