Science with Passion

Application No.: VPH0070
Version 1 04/2019
(C)an(n)alyze: determination of 16 cannabinoids inside flowers, oils and seeds
Lisa Loxterkamp, Svea Stephan, Kate Monks; applications@knauer.net
KNAUER Wissenschaftliche Geräte GmbH, Hegauer Weg 38, 14163 Berlin
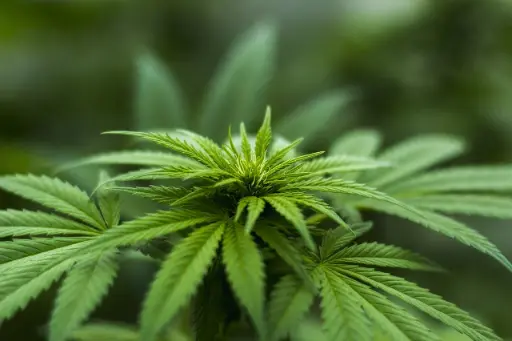
Photo: unsplash.com
Summary
Research within cannabinoids for pharmaceutical purposes increases, likewise does the number of substances to be tested. Therefore, compared to the German pharmacopoeia (Deutsches Arzneibuch; DAB), an increase of 10 cannabinoids was performed for qualification and quantification with this work. The aim of the method development was to decrease the runtime and optimize the gradient program in comparison to the DAB method [1]. To ensure accuracy of the method, a validation was performed according to ICH Guidelines Q2 R1 [2]. Parameters for the validation were selectivity, linearity, repeatability and the recovery rate. The given specification was derived from the Association of Official Analytical Chemists (AOAC) with the given standard method performance requirements for cannabis flowers and oils [3].
Introduction
Cannabis sativa L. is one of the oldest agricultural and medicinal plants, which produces a variety of compounds such as terpenoids, flavonoids and cannabinoids [4]. The interaction of cannabinoids with the body’s own cannabinoid receptors, which occur in a variety of brain cells for coordination, memory processing and spatial orientation, enables new pharmacological and psychological treatment options5. Probably the most psychoactive cannabinoid of the 4 different isomers of Δ9-THC is the (-)-Δ9-trans-tetrahydrocannabinol, also known as dronabinol (Fig. 1). In Germany Δ9-THC is controlled by the narcotics law (Betäubungsmittelschutzgesetz; BtMG) due to its psychoactive properties. Since March 2017 the regulations changed by the amendment of article 1 BtMG. The amendment of annexes II and III of the BtMG now allows cannabis such as marijuana plants and plant parts to be marketed and prescribed.
Thereby, cannabis was authorised for medical purposes as ready-to-use medicinal products6. Production of cannabis products must be conducted and monitored in accordance with good manufacturing practice guidelines (GMP) to guarantee accurate labelling of medicinal products, food and cosmetics.
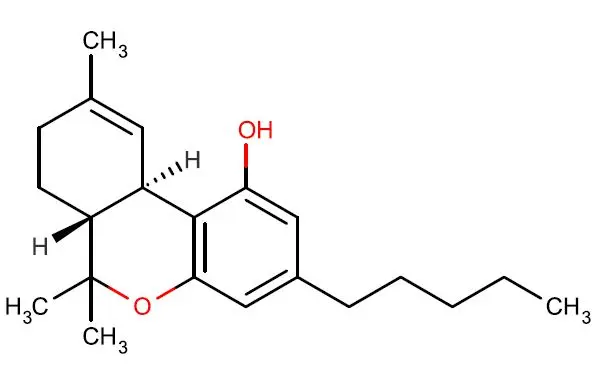
Fig. 1 Structure of (-)-Δ9-trans-tetrahydrocannabinol.
Introduction
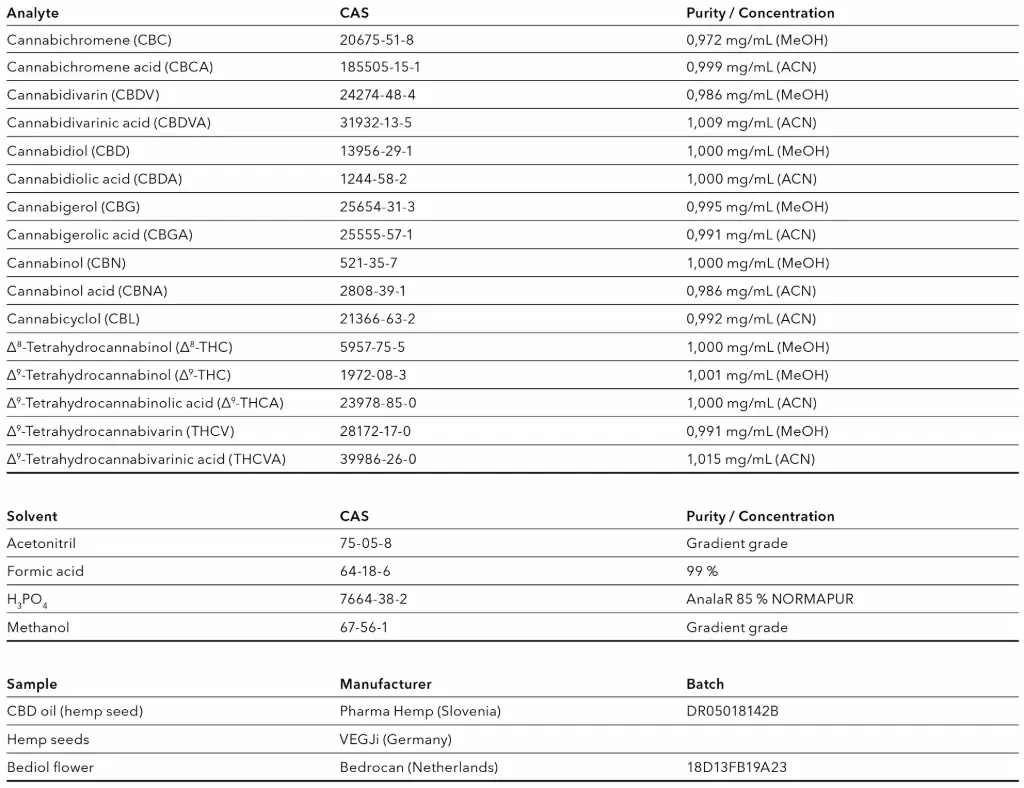
Therefore, the demand for standardized methods for the quantitative and qualitative determination of the ingredients especially the cannabinoids is increasing [7]. In this work an HPLC method development for the qualification and quantification of 16 different cannabinoids inside the matrices flowers, oils and seeds was carried out with the KNAUER AZURA® HPLC system. In order to check the performance of the method, a validation according to the ICH Guidelines Q2 R1 was carried out2. The tested cannabinoids are described in Tab. 1.
Results
As shown in previous work, the column Eurospher II C18P 100-3, 100 x 4.6 mm was determined as the most robust one while separating 6 different cannabinoids [7]. Therefore, the development was carried out with a C18P phase. The final method was selected to provide the best compromise of a simple method with short runtime and high resolution (Tab. 5). During the method development, the aqueous eluent was acidified once with phosphoric acid and once with formic acid to pH 2.2 with the result of no difference in elution behavior. In all following chromatograms 2 different absorption lines were monitored. While the blue line is detected at 228 nm, the red one is detected at 306 nm. Due to the various absorption behavior of each cannabinoid, a differentiation between the neutral and acid forms can be concluded. The resulting chromatogram with a 5 µg/mL standard mix is shown in Fig. 2.
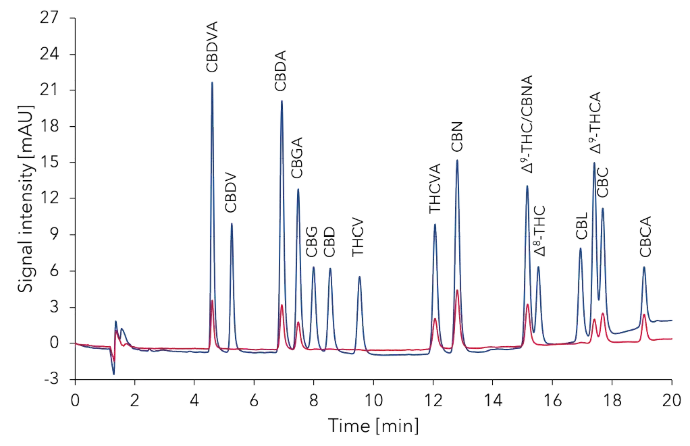
Fig. 2 Reference standard mixture of 16 cannabinoids with a concentration of 5.00 µg/mL (blue: 228 nm; red: 306 nm).
To confirm the selectivity within the given matrices flower, oil and hemp seeds, 3 different samples were measured during the method development and before validation. The chromatograms are shown in Fig. 3 to Fig. 5.
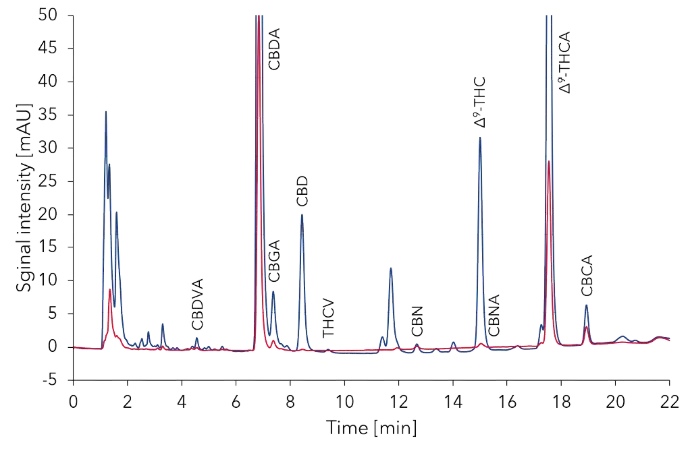
Fig. 3 Bediol sample preparation according to Mudge et al. 2017, 0.84 mg flower/mL methanol (blue: 228 nm; red: 306 nm) [9].
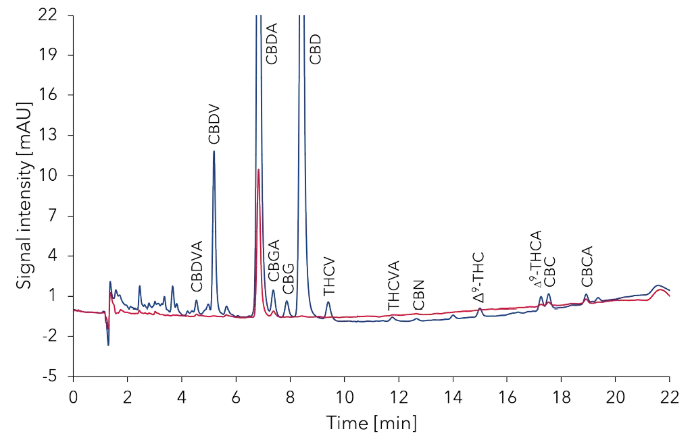
Fig. 4 CBD oil sample preparation according to Mudge et al. 2017, 0.62 mg oil/mL methanol (blue: 228 nm; red: 306 nm) [9].
Results
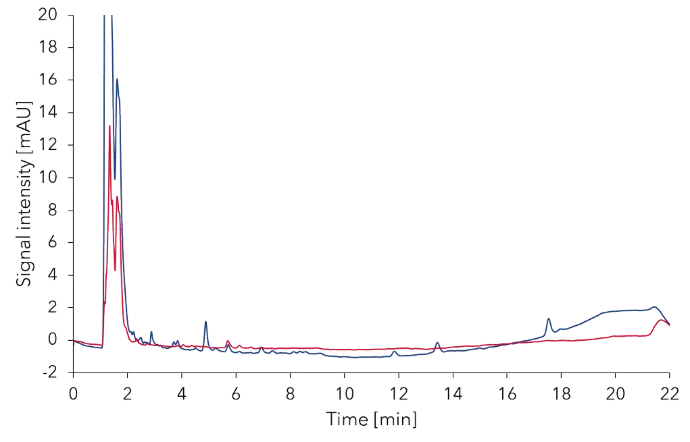
Fig. 5 Hemp seed sample preparation according to Mudge et al. 2017, 22 mg seeds/mL methanol (blue: 228 nm; red: 306 nm) [9].
Up to 11 cannabinoids were found in the cannabis sample bediol and 6 of them were within the calibration range of 0.15 - 75.00 µg/mL. 8 out of 13 cannabinoids could be quantified within the oil matrix. As previously suspected the matrix „hemp seed“ showed no cannabinoids within the calibration range. In all cases the quantification of Δ9-THC is only possible in the absence of CBNA. This is confirmed by the absorption at 306 nm. Since CBNA is a degradation product of Δ9-THCA, it only occurs in products that have been stored for a longer time. During this validation CBNA was only found in a trace amount in bediol. This amount correlates with the high amount of Δ9-THCA inside the bediol sample as well as the long storage since the harvest in April 2018.
The following results were produced within the validation. During the calibration it was figured out that linearity was given between the concentration of 0.15 - 75.00 µg/mL. All calibration curves in the range of 0.15 - 75.00 µg/mL were passing the variance homogeneity as well as the linearity after the mathematical equation of Mandel. The resulting coefficients were all above R > 0.999 for every cannabinoid. The calibration curves are shown respectively for the cannabinoids CBD, CBDA, CBN, Δ9-THC and Δ9-THCA in Fig. 6.
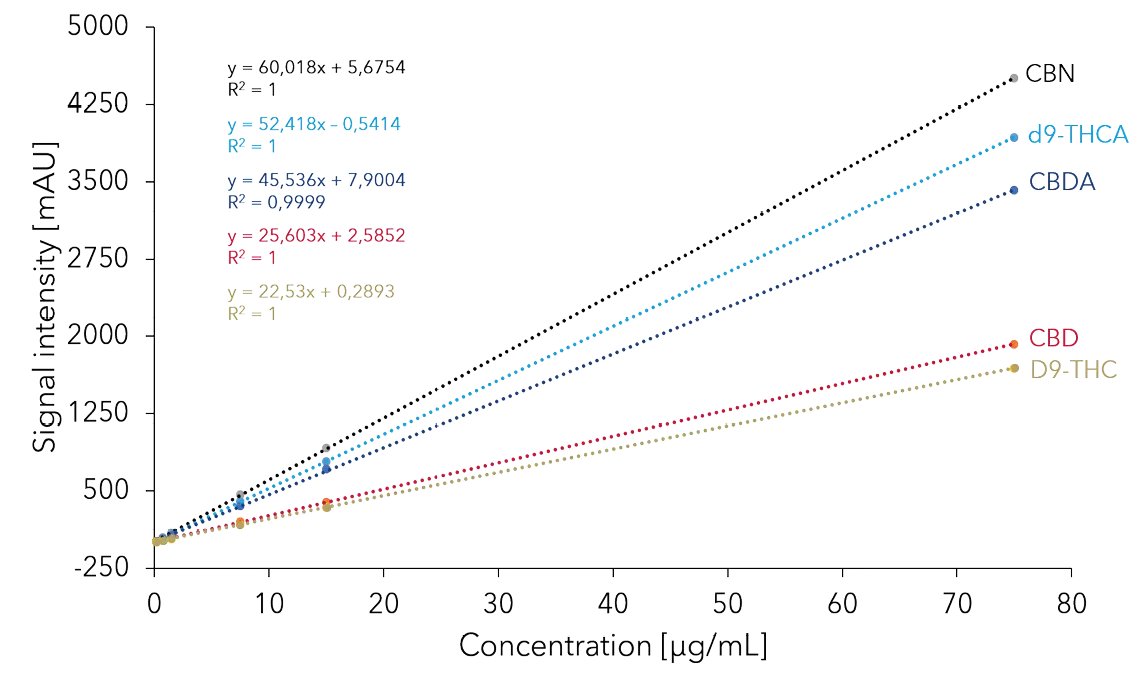
Fig. 6 Calibration curves and linearity for the cannabinoids CBD, CBDA, CBN, Δ9-THC and Δ9-THCA at 228 and 306 nm.
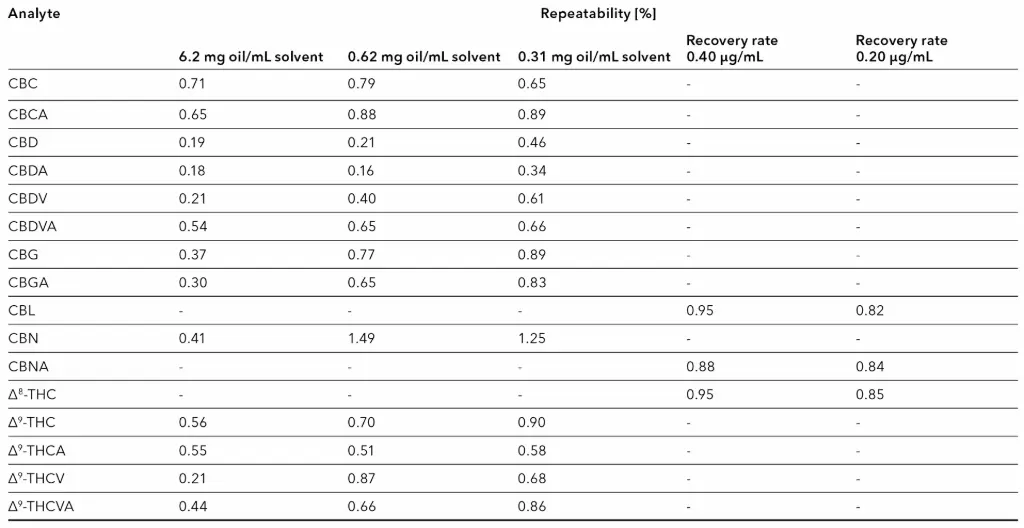
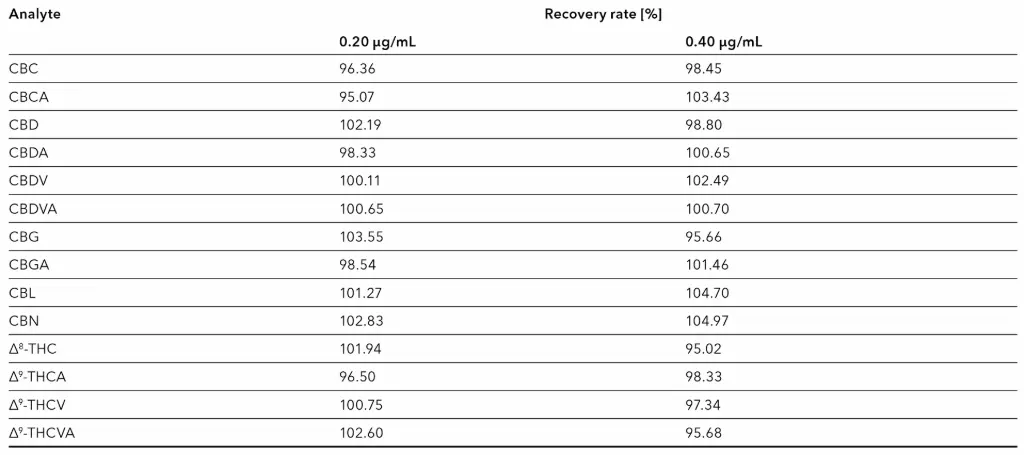
The repeatability was measured with a six-time repetition of different concentrations inside the CBD oil. This was made to ensure reproducibility over the entire calibration range. The area ratios of the different dilutions range from 0.6 - 5200 mAU*s. The results of the repeatability shown in Tab. 2 are all below 1 % relative standard deviation (RSD) and thereby within the lowest limit of RSD < 2 % by the AOAC3. Even CBN with an area of 0.6 mAU shows an RSD of under 2 % and is therefore within the limits. CBL, CBNA and Δ8-THC could not be detected inside the CBD oil, so the verification was made over a six-time repetition within the recovery rate. The recovery rate was evaluated within 2 different concentration levels close to the lowest calibration value. A blank sample was spiked with 50 µL/100 µL of each cannabinoid standard (0.1 mg/mL) filled up with 25 mL solvent and was prepared 3 times according to Mudge et al. 20179. For both quantified levels (0.20 and 0.40 µg/mL) the recovery rates were in between the specification range of the AOAC from 95 - 105 %. The results are shown in Tab. 3.
Sample preparations
5 g of bediol were grinded with a flower grinder. The hemp seed was grinded with a kitchen mixer, after a mechanical pretreatment to open the seeds. The difference between grinded and original bediol and hemp seeds is shown in Fig. 7. The sample preparation was performed according to Mudge et al. 2017, where 200 mg flowers/seeds were extracted with
25 mL 80 % methanol or 50 mg oil were extracted with 10 mL methanol for 15 min inside an ultra-sonic bath, with every 5 min shaking onto a vortex device9. After filtrating over a 0.20 µm PTFE syringe filter the solution was measured with the HPLC system.
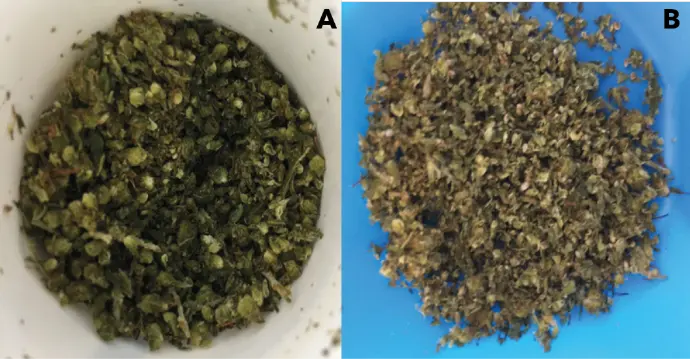
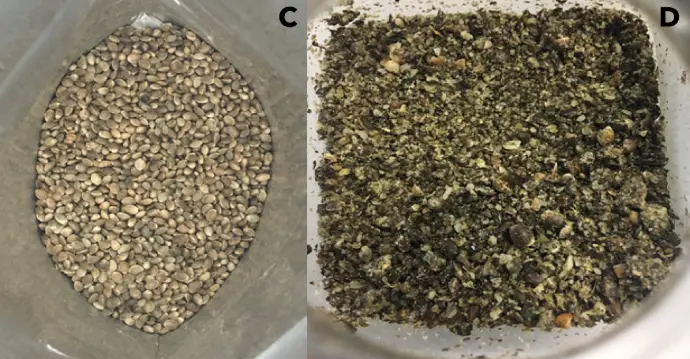
Fig. 7 Bediol sample: original (A) and grinded (B). Hemp seeds: orgininal (C) and grinded (D).
Conclusion
Compared to the given pharmacopoeia from 2017 a 20 min shorter method with a less acidic eluent was developed1. The separation of all 16 cannabinoids was achieved with a sufficient resolution in both, the standard mixture and the 3 different sample matrices. The developed method is suitable for the qualification and quantification of 15 cannabinoids in the absence of CBNA. The validation was performed according to the given ICH Q2 R1 guideline with standard method performance requirements of the AOAC. In accordance with the prescribed laws for hemp cultivation, the lowest calibration point of 0.15 µg/mL (0.02 %) falls below the maximum specification content of 0.2 % Δ9-THC by one order of magnitude. Additionally, in all cases the correlation coefficient of the linearity was over R > 0.999. The recovery rate and the repeatability were inside the performance requirements of the AOAC.
KNAUER does not endorse the use of its products in connection with the illegal use, cultivation or trade of cannabis products. KNAUER does not endorse the illicit use of marijuana, we merely provide an overview of the methods and systems of cannabis analysis.
Materials and Methods
Tab. 1 Standard solutions and samples
Tab. 2 Repeatability of all cannabinoids
Tab. 3 Recovery rate of all cannabinoids
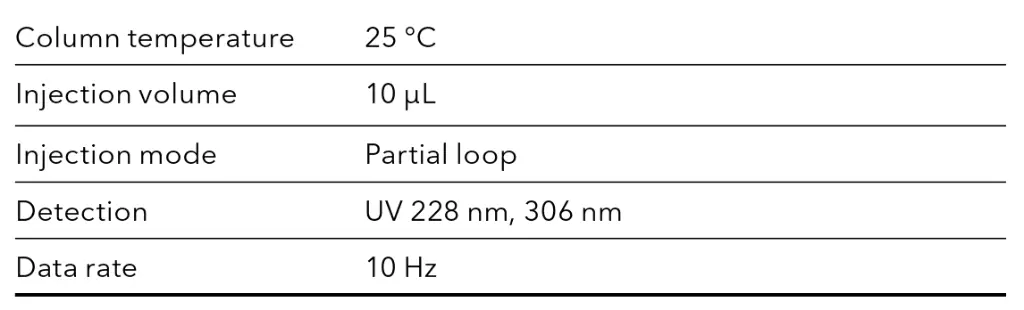
Tab. 4 Method
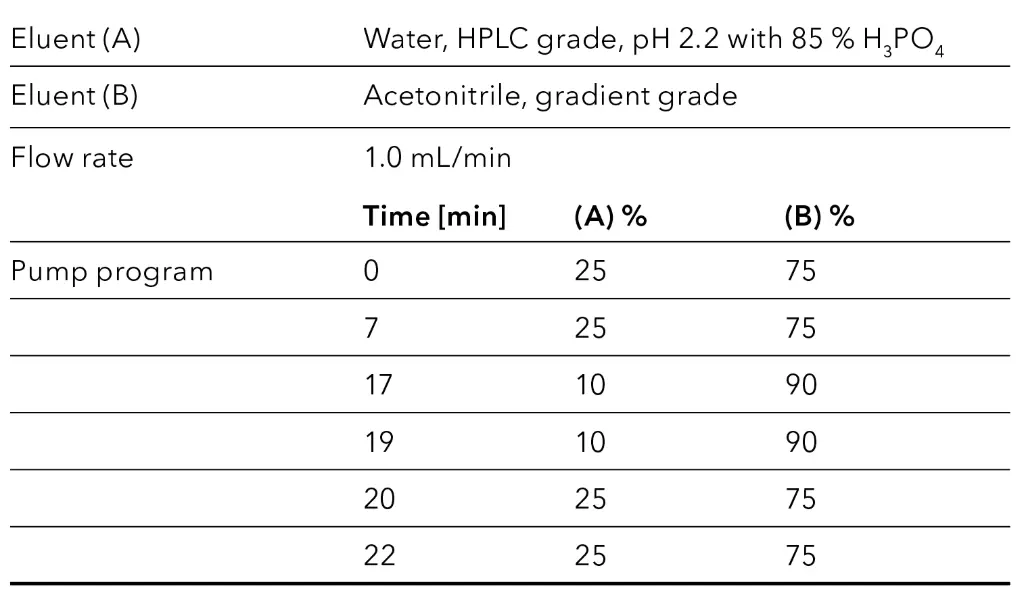
Tab. 5 Gradient
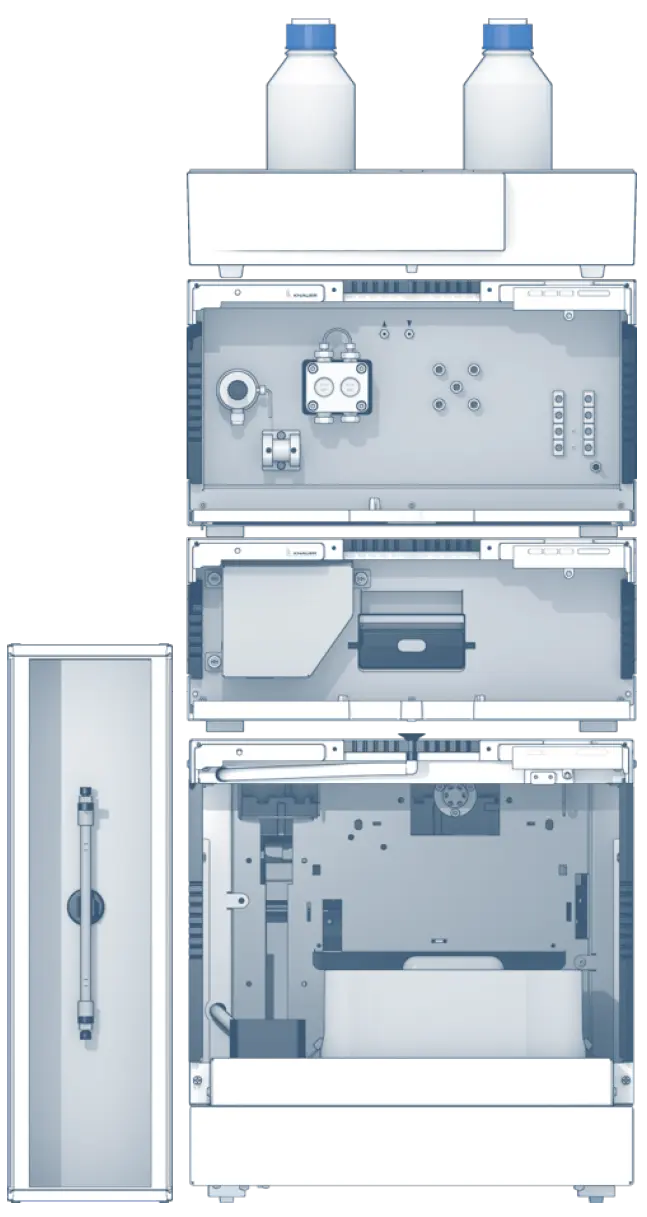
Tab. 6 System configuration
Instrument | Description | Article No. |
Pump | AZURA P 6.1 L LPG | |
DAD detector | AZURA MWD 2.1 L | |
Flow cell | 10 mm, 10 µL, PressureProof | |
Autosampler | AZURA AS 6.1 L | |
Column thermostat | AZURA CT 2.1 | |
Column | Eurospher II 100-3 C18P, 150 x 4.6 mm | |
Software | ClarityChrom 8.1 |
References
[1] Deutsches Arzneibuch 2017 (DAB). Allgemeiner Teil. Deutscher Apotheker Verlag (2018).
[2] The International Council of Harmonisation of Technical Requirements for the Registration of Pharmaceuticals for Human Use (ICH) Validation of analytical procedures: text and methodology, Q2(R1). CPMP/ICH/381/95 (1995).
[3] Association of Official Analytical Chemists (AOAC). New SPSFAM Draft Standard Method Performance Requirements (SMPR): Cannabis 2 SMPRs (2016).
[4] Hoch, E., Friemel, C. M., Schneider, M. Cannabis. Eine Wissenschaftliche Bestandsaufnahme. Springer: Berlin, Heidelberg (2018).
[5] Grotenhermen, F. Endogene Cannabinoide und das Endocannabinoidsystem. In: Handbuch Psychoaktive Substanzen. von Heyden, M., Jungaberle, H., Majic, T. Springer: Berlin, Heidelberg (2018).
[6] Gesetz über den Verkehr mit Betäubungsmitteln „Betäubungsmittelgesetz in der Fassung der Bekanntmachung vom
1. März 1994 (BGBI. I S.358), das zuletzt durch Artikel 1 der Verordnung vom 2. Juli 2018 (BGBI. I S.1078) geändert worden ist“. BtMG (1981).
[7] Loxterkamp, L., Monks, K. Analyzing cannabis flowers according to the German Pharamacopeia. KNAUER Wisschenschaftliche Geräte GmbH (2019).
[8] Smith, B. C. Inter-lab variation in the cannabis industry. Part I: Problem and causes. Cannabis Science and Technology 2 (2), (2019).
[9] Mudge, E. M., Murch, S. J., Brown, P. N. Leaner and greener analysis of cannabinoids. Analytical and Bioanalytical Chemistry 409 (12), 3153-3163 (2017).
Related KNAUER Applications
VPH0069 – Analyzing cannabis flowers according to the German Pharmacopeia - monograph 2017
VPH0072 – Analyzing cannabis flowers according to the German Pharmacopeia - monograph 2018
Application details
Method | HPLC |
Mode | RP |
Substances | CBC, CBCA, CBDV, CBDVA, CBD, CBDA, CBG, CBGA, CBL, CBN, CBNA, Δ8-THC, Δ9-THC, Δ9-THCA, THCV, THCVA |
CAS number | 20675-51-8, 185505-15-1, 24274-48-4, 31932-13-5, 13956-29-1, 1244-58-2, 25654-31-3, 25555-57-1, 521-35-7, 2808-39-1, 5957-75-5, 1972-08-3, 23978-85-0, 28172-17-0, 39986-26-0 |
Version | Application No.: VPH0070 | Version 1 04/2019 | ©KNAUER Wissenschaftliche Geräte GmbH |